By Ismael Peña-López (@ictlogist), 10 November 2006
Main categories: Development
2 Comments »
The United Nations released on November 9th, 2006 the Human Development Report 2006, mainly focusing in two aspects:
- The core of the report: a monograph on water
- The publication of the Human Development Indicators
Concerning the first aspect, I just congratulate the UN for having made the effort of compiling and working in a subject that has long been told to be the main reason for this century’s conflicts, call it the Water Wars. Taking into account all bad news about climate change and the ongoing global warning, water might not be an issue, but the issue.
I somehow expected to see a section about the contribution of ICTs to water crises (re)solution
, but I guess I am a little bit biased towards this field ;)
About the second aspect, I think the best highlight to be made is the one about income (increasingly unbalanced) distribution.
The world’s 500 richest people have an income of more than $100 billion, not taking into account asset wealth. That exceeds the combined incomes of the poorest 416 million. Wealth accumulation at the top of the global income distribution has been more impressive than poverty reduction at the bottom.
This is quite hard to bear. Provided that, with increasing productivity, the global economy is not a zero-sum game (i.e. what I win equals to what you lose), if inequalities increase this means that not only all productivity gains go to few hands/pockets, but that greed asks even for other people’s gains… and more. “So, you’re stepping into the typical discourse of making feel guilty the ones that have?”. Yes, I am.
In another order of things, is a nice exercise to “play” with the interactive graphic that relates income to human development. It’s curious to see how big differences in income (here measured by the GDP per capita) can produce similar a human development index (HDI), and even more: how countries with higher GDP per capita than other ones end up having lower HDI. It would be interesting to compare these differences with the corresponding Gini Indices: in some countries it seems like, again, inequalities might explain these differences in “performance”. See, for instance, some of the main oil producers in the Middle East such as the United Arab Emirates, Qatar or Saudi Arabia compared to Mexico, Venezuela or Sri Lanka, where oil revenues don’t necessarily are equally distributed. See, also, what happens in South Africa compared to Bolivia, and guess what’s the heritage of Apartheid.
Main links
P.S.: I hope the UNDP made available spreadsheet files instead of PDF files as an easier way to provide all data as a whole.
By Ismael Peña-López (@ictlogist), 05 July 2006
Main categories: Development, ICT4D
1 Comment »
The Millennium Development Goals Report 2006 has just been released and the main conclusion is “well… errrr… we’ve not accomplished almost anyhting… some things have indeed worsened… but, hey, let’s give a positive and optimist message that there’s some change to move into the right path”.
Concerning ICT’s and ICT4D it is evident that, actually, there’s an increasing adoption of these technologies at all levels:
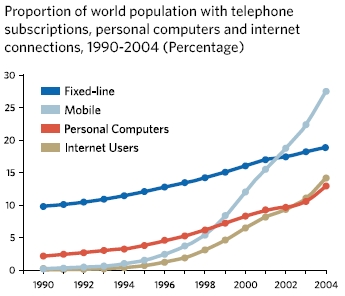
Proportion of world population with telephone subscriptions, personal computers and internet connections, 1990-2004 (Percentage). Source: Millennium Development Goals Report 2006
But I’m “glad” to read that:
[there is] a large digital divide separating developed and developing
regions: Over half the population in developed regions had access to the Internet, compared to 7 per cent in developing regions and less than 1 per cent in the 50 least developed countries.
Of course I’m not “glad” to read that there is a digital divide, but that at least someone recognizes it exists and, regardless of the fact that in relative terms the divide has decreased, in practical terms it is so huuuuuuge that shame on you for sticking to righteous-and-oh-so-formally-correct statistical data interpretation. This is something I wrote about in my post World Telecommunication/ICT Development Report 2006: digital divide narrowing?
and feel comforted to see that I’m not the only one looking at it this way.
By Ismael Peña-López (@ictlogist), 29 March 2006
Main categories: Development, e-Readiness, ICT4D
1 Comment »
The World Economic Forum has released the Global Information Technology Report 2005-2006, being one of the more interesting outputs the Networked Readiness Index (NRI). A pity — like most cases — you have to pay to get the full report.
In open access you can find:
I’d usually finish here my post, but tickling is tickling.
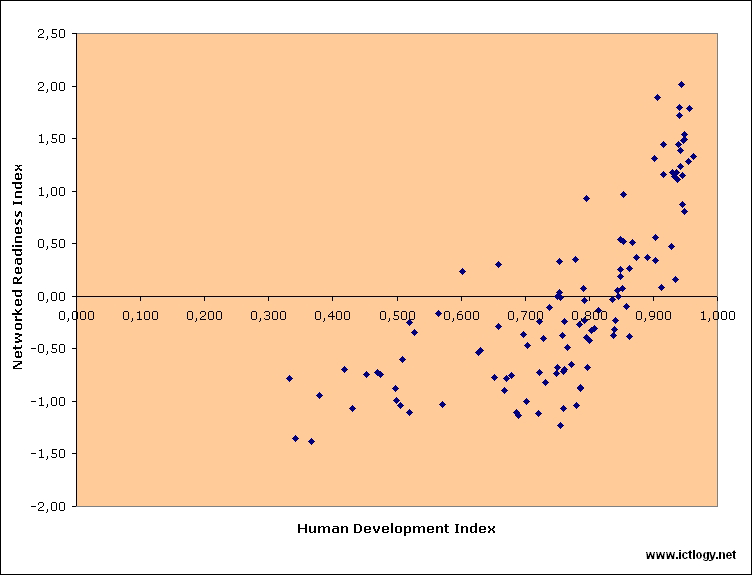
I put in a table both the Networked Readiness Index (NRI) and the
Human Development Index (HDI). In another table, same NRI against the Education Index extracted from the HDI. And plotted a couple of graphics shown below.

[click to enlarge]
On vertical axis, NRI. On horizontal axis, HDI. Main remarks:
- Almost all countries with high NRI are above 0.8 HDI. And they behave in quite a similar way, with a progressive but quick adoption of ICTs the higher the HDI. Significative.
- Notable exceptions: South Africa and India, the last two points on the left, with HDI among 0.6 and 0.7
- Above (around) HDI = 0.6 and up, the tendency stays the same: steppy courve of adoption… but without adoption, as NRI is below 0. Some of them (HDI among 0.6 and 0.7) might be doing the effort of entering ICTs, but to their economies this is a real effort. Some of them (HDI above 0.8) should have their rules fired immediatly and replaced by other ones with better e-awareness (Bosnia and Herzegovina an exception for logical reasons of reconstruction).
- Below HDI = 0.6, those countries with HDI below 0.6 they do have an opportunity to catch up with the potential train-misser ones (the ones with HDI above 0.6 but NRI below 0). Surely the effort would be worth doing it… in case it could be done. These countries are really poor (and most of the poorest don’t even show in the map as they were not counted when computing the NRI!).
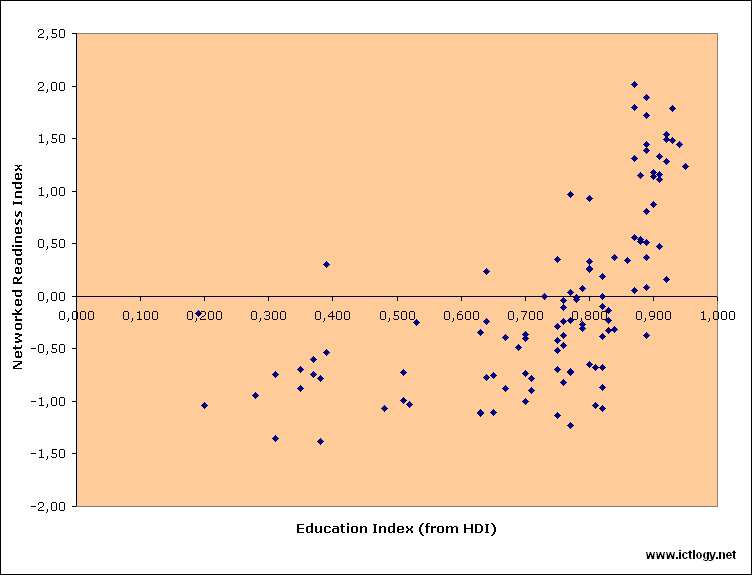
[click to enlarge]
On vertical axis, NRI. On horizontal axis, Education Index. I guess same analysis applies than in the previous graphic, though the dispersion is a little bit bigger. It seems as if education was not as important as power in adopting ICTs, as the whole cloud of points looks shifted leftwards some 0.05 in the index (but this could be explained as the HDI itself is 0.05 shifted upwards in relation to the Education Index).
All in all
- Two tendencies: one in the road to ICTs adoption, one just left behind.
- Two groups of countries under NRI under 0: one trying to, the other one completely abandoned to his luck.
- One group of countries (high HDI, low NRI) that could have changed their status in the world scenario if they don’t success / try to catch the digital train.
Sincere thanks to my colleague Albert Padró-Solanet for valuable hints with stats.
By Ismael Peña-López (@ictlogist), 14 March 2006
Main categories: Development
No Comments »
Looking for some information on the MDG, I found plenty of “official” sites. Being unable to discriminate the best amongst them, here they go:
If this list updated, that’ll happen in the Millennium Development Goals page in the ICT4D Wiki.
By Ismael Peña-López (@ictlogist), 06 March 2006
Main categories: Development
No Comments »
Reading the Progressive ICT Review I find Relief Web, an
on-line gateway to information (documents and maps) on humanitarian emergencies and disasters. An independent vehicle of information, designed specifically to assist the international humanitarian community in effective delivery of emergency assistance, it provides timely, reliable and relevant information as events unfold, while emphasizing the coverage of “forgotten emergencies” at the same time.
ReliefWeb was launched in October 1996 and is administered by the UN Office for the Coordination of Humanitarian Affairs (OCHA).
Their Map Centre is impressive and fool of good and brand new information, everything in the shape of a Map. You can even subscribe (mail or RSS) to the updates.
Adding up, Development Maps:
By Ismael Peña-López (@ictlogist), 13 September 2005
Main categories: Development
No Comments »
UNDP‘s Human Development Report for year 2005 is out.
Progress on aid, trade and security must be linked: We know that the MDGs are attainable, but if we continue with business as usual, the promise of the Millennium Declaration will be broken. That would be a tragedy above all for the world’s poor—but rich countries would not be immune to the consequences of failure
Extreme inequality slows progress: Anybody questioning whether income distribution matters might reflect on the fact that the poorest 10 percent of Brazilians are poorer than their counterparts in Viet Nam, a country with a far lower average income

 Human Development Report 2006 (7.88 Mb)
 Networked Readiness Index rankings