By Ismael Peña-López (@ictlogist), 01 October 2007
Main categories: Connectivity, e-Readiness, Hardware
1 Comment »
The OECD has released its Communications Outlook for year 2007
The main conclusions are as follows:
- Voice continues to be the key driver in OECD telecommunication markets
- Mobile subscribers outnumber fixed subscribers by a
ratio of 3 to 1
- Rise of importance of Voice over Internet Protocolo (VoIP), mainly due to rise of broadband adoption, and pressing down prizes on voice services
- Blurring of market barriers: e.g. voice no more tied to fixed analogue lines, but can be accessed through fixed analogue lines, but also through broadband, mobile lines, etc.
- Blurring of market barriers, multiplicity of offers, blurring of regulation.
- Rise of local wireless networks fostered by local administrations.
- Shift from paying for voice to paying for data; shift from paying for data to flat-rate pricing based on bandwidth quality instead of data traffic.
- Trend to lower broadband prizes for better quality.
- Shift of subscription of communication services provided outside the boundaries of a citizen’s country and delivered over the Internet: more pressure on regulation changes.
- Telecommunication trade continues to grow in the OECD area
and now accounts for 2.2% of all trade.
- China is one of the five emerging countries in the group known as the BRICS (Brazil, Russia,
India, China and South Africa). ICT spending in the BRICS economies increased by more than 19% a year
Summing up:
- The importance of broadband — the new leading factor of the digital divide.
- The pressure on sector and international regulation — the new arena of the debate to achieve harmonization, inside and outside boundaries.
By Ismael Peña-López (@ictlogist), 31 August 2007
Main categories: e-Readiness, ICT4D, Meetings
Other tags: ict4d_symposium_2007
No Comments »
Andrea Burris
Creativity in the Information Economy: China Case Study
Andrea begins her session with an introduction to Economics fundamentals: relative advantage, surplus, etc. The question being: in the Information Society, how does surplus, the production function, etc. have changed respect to agricultural and industrial economies?
Technological change shifts the production function (see reference to Max H. Boisot at the end), but also makes that the level of chaos, that evolved from an “ordered” regime, through a complex regime, to a chaotic regime, drops back to an ordered regime again. The difference being that, normally, analyzes focuses on changes on end products and not on changes on processes.
Creativity is about going beyond the established frontiers of the actual technology/possibilities, about pushing the limits.
Mikko Vesisenaho
Developing contextual higher level introductory ICT education in Tanzania
Local vs. global approach to education moving further and further away from one another. Need for more contextualization. Efficiency, effectiveness, impact and sustainability situated in relation to dimensions of contextual relevance and standardized performance.
Research questions
- What kind of framework is feasible for understanding ICT transfer in developing country like Tanzania?
- How was contextualization taken into account into the Contextualized Programming?
- What were the meaningful contextual outcomes of the Contextualized Programming?
David Hollow
Assessing Education and ICTs
Highest importance of evaluating projects: if we do not carry on any impact assessment, are we making any difference at all?
What to focus in an assessment?
- indicators
- baselines
- relationships
Educational levels
- Bloom: knowledge, comprehension, application, analysis, synthesis, evaluation
- Anderson: remembering, understanding, applying, analyzing, evaluating, creating
And we usually evaluate at the first level, at the knowledge/remembering levels, instead of evaluating e.g. creating
My comments
- David talks about what and how we can assess but I wonder whether the where the assessment takes place is also relevant: (only) in the classroom? also assessing the students output i.e. the portfolio? under a “digital natives” train of though, also their digital identities and creation (e.g. uploads to MySpace, YouTube, Flickr, and so.)?
More info
Second Annual ICT4D Postgraduate Symposium (2007)
By Ismael Peña-López (@ictlogist), 31 August 2007
Main categories: e-Readiness, ICT4D, Meetings
Other tags: ict4d_symposium_2007, phd
No Comments »
Ismael Peña-López
Unpeeling the layers of the digital divide: category thresholds and relationships within composite indices
The goal of this research is to add reflection and knowledge to the belief that there is an important lack of tools to measure the development of the Information Society, specially addressed to policy makers aiming to foster digital development. We believe there is still an unexplored point of view in measuring the Information Society which goes from inside-out instead of outside-in. In other words, the main indices and/or reports focus either in technology penetration or in the general snapshot of the Information Society “as is”. There is, notwithstanding, a third approach that would deal with working only with digital-related indicators and indices, thus including some aspects not taken into account by the technology penetration approach (i.e. informational literacy), and putting aside some “real economy” or “analogue society” indicators not strictly related to the digital paradigm. Relationships between subindices would also provide interesting insight for policy makers on which to ground the design of their initiatives.
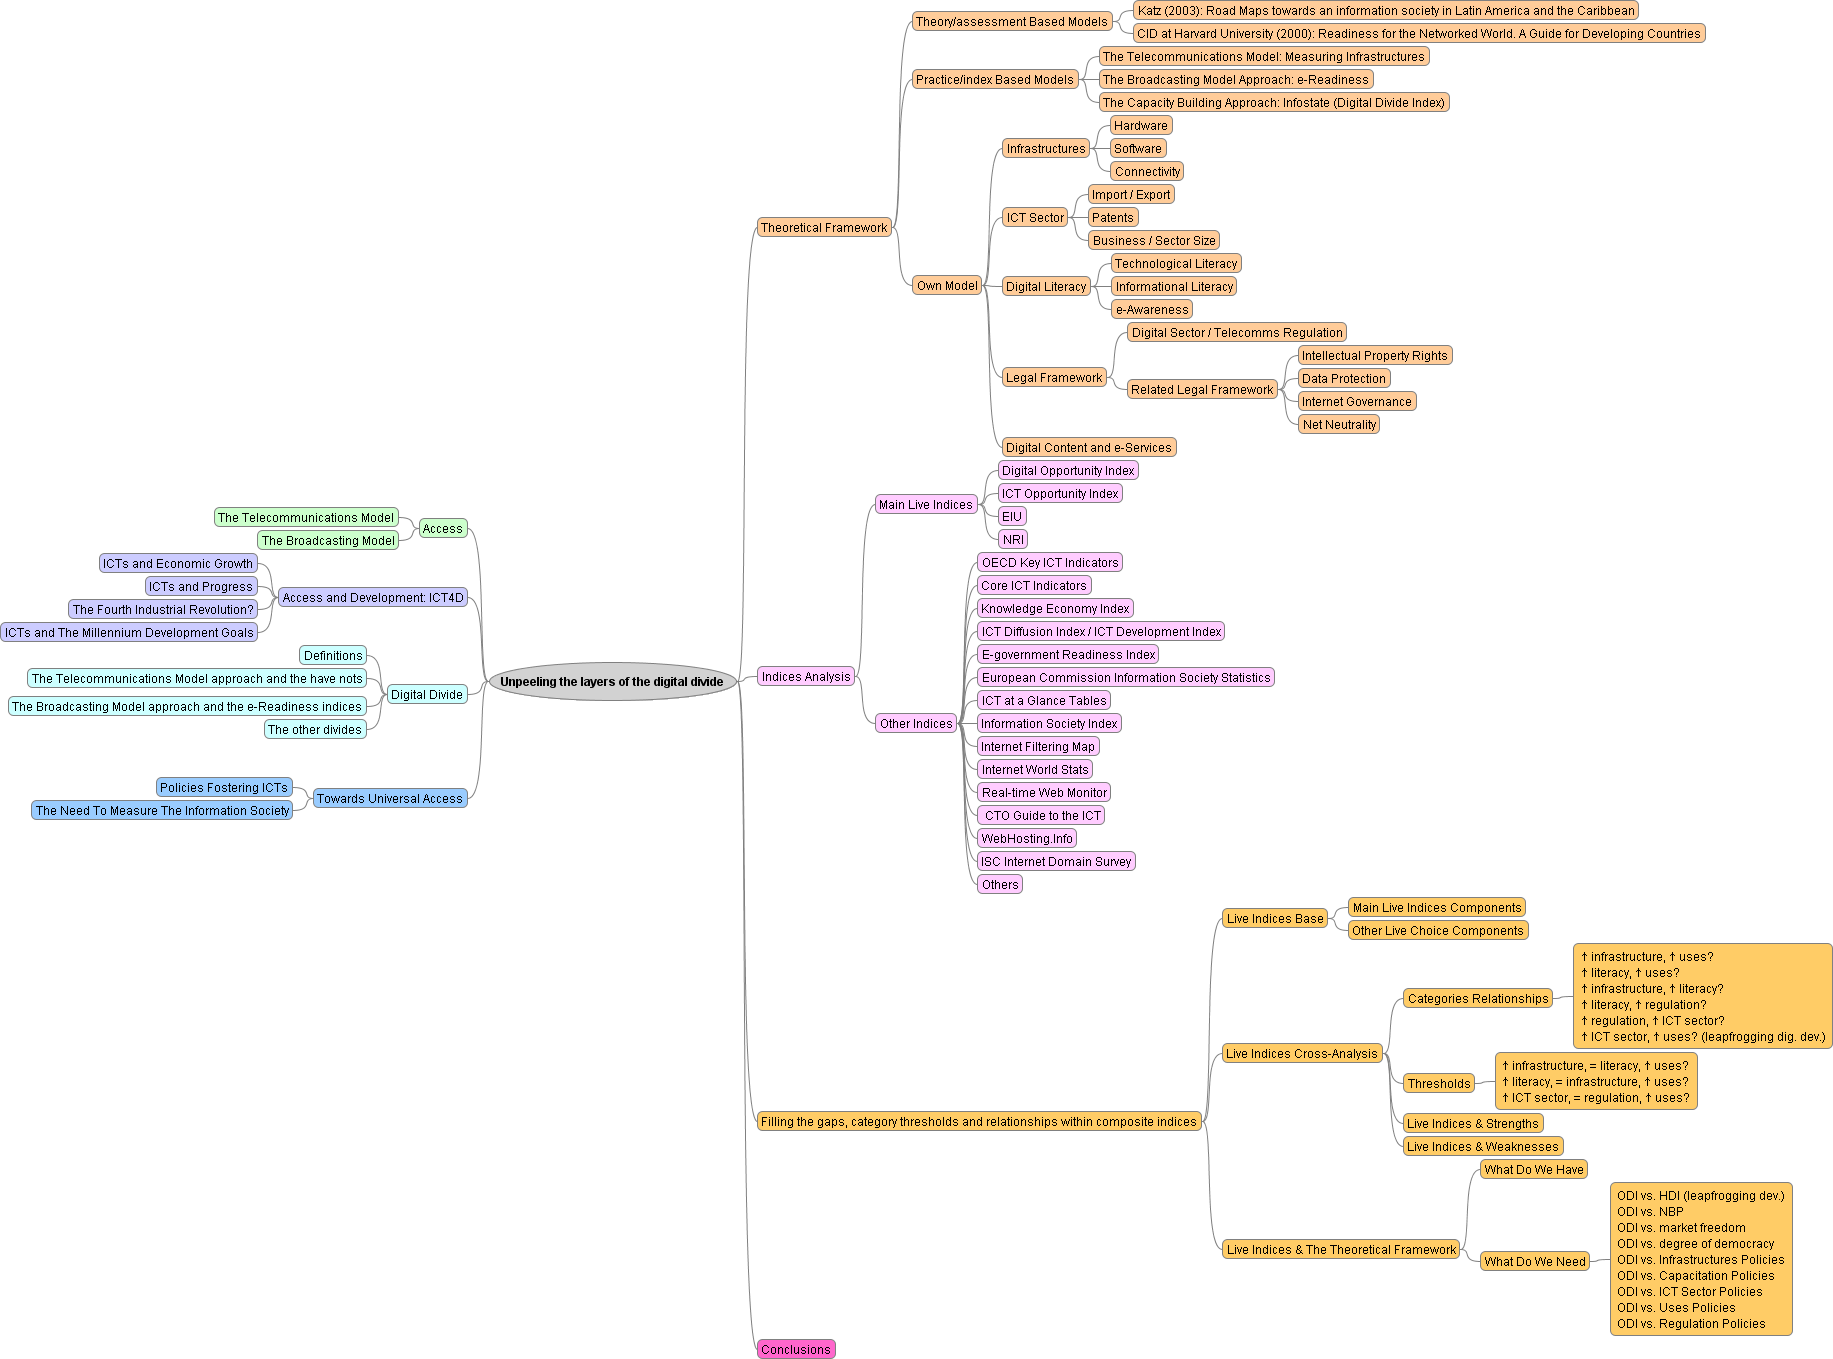
Presentation as a mental map:
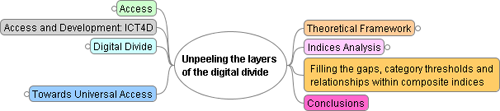
Unpeeling the layers of the digital divide
[click to enlarge]
Working bibliography
Some comments/suggestions I got:
- The importance of context when designing indices and how this context might challenge the accuracy, objectivity, suitability of these indices
- The importance, beyond infrastructures, of international services broadcasters such as BBC or Voice America
- Analyzing what the (real) goal, purpose of the indices is. How and, over all, why are they built the way they are
- The importance of not only looking at what worked (e.g. projects and policies to foster the information society), but also what has failed, what and how many are the failed projects
- The opportunity to develop different indexes according to the different countries, contexts, etc.
- context, context, context
Florence Nameere Kivunike
Measuring the Information Society: An Explorative Study of Existing Tools
Why assess the Information society
- Current status
- Comparison
- Tracking progress
- Policy, decision-making
- Research-related
- Value-judgment
What is assessed
- Social
- Economic
- Institutional
Temporal concept
- Readiness
- Intensity
- Impact
Limitations
- Focusing mainly on infrastrucutre
- Relationships among features
- Limited consideration of context in terms of the enabling factors e.g. social or cultural setup and flexibility
- Oversimplified methods characterized by subjective approaches
Challenges of IS Assessment
- Dynamic and complex nature of the IS
- Data constraints especially in development countries
- Challenge of measuring transformation
More info
- Menou, M. & Taylor, R. (2006) A “Grand Challenge”: Measuring Information Societies. 22, The Information Society p 261-267
Second Annual ICT4D Postgraduate Symposium (2007)
By Ismael Peña-López (@ictlogist), 24 July 2007
Main categories: Digital Divide, Digital Literacy, e-Readiness, ICT4D, Meetings
Other tags: phd, sdp2007
No Comments »
The goal of this research is to add reflection and knowledge to the belief that there is an important lack of tools to measure the development of the Information Society, specially addressed to policy makers aiming to foster digital development. We believe there is still an unexplored point of view in measuring the Information Society which goes from inside-out instead of outside-in. In other words, the main indices and/or reports focus either in technology penetration or in the general snapshot of the Information Society “as is”. There is, notwithstanding, a third approach that would deal with working only with digital-related indicators and indices, thus including some aspects not taken into account by the technology penetration approach (i.e. informational literacy), and putting aside some “real economy” or “analogue society” indicators not strictly related to the digital paradigm. Relationships between subindices would also provide interesting insight for policy makers on which to ground the design of their initiatives.
Michael Best comments that it’ll be interesting to test too the impact of the indices that measure the information society on policy makers and the policies they make up to foster the information society. I guess that maybe the way to do this would be to compare the series of an e-readiness indicator and the series of regulations issued during the same period of time in a country.
More info
SDP 2007 related posts (2007)
By Ismael Peña-López (@ictlogist), 16 July 2007
Main categories: Digital Literacy, e-Readiness, Meetings
Other tags: sdp2007
No Comments »
With over a million young people “born digital,” now is the time to examine the emerging trends of how these digital natives construct identity, learn, create, and socialize in an ever-changing “always on” landscape. How do we give digital natives the tools (in terms of know-how, technology, social norms, or other means) to navigate safely in the emerging digital social space? How can copyright holders work with digital creators to understand their needs and practices in a way that doesn’t stifle their creativity? As a global society, can we come to understand what’s happening with a generation online, to embrace a digital present, and to shape, in constructive ways, a more digital future?
Working papers on Digital Divide, the Spread of the Internet and Political Institutions
What does it mean to be a Digital Native?
- Digital Identity: Identity was something I could control… can I control my Digital Identity? Or, on the contrary: online identity can be shaped, created absolutely the way I want it to be
- Multitasking: Distraction or multitasking?
- Digital Media: Flickr, Google Print, YouTube…
- Digital Creativity: Consumers in the past… what now? Quite a switch. Can we relate it with… Democracy?
Technologies that enable/empower the digital native
- RSS feeds, of course, that link together (free) web 2.0 applications.
- Lightweight collaboration: Wikipedia?
- New contexts, new meanings
- Tagging
- International scope: shrinking the world
Issues:
- Security
- Privacy: unintended audience; how to remove information about me on the Internet, information that can be massively processed (i.e. image recognition); identity theft, erosion
- Intellectual property: copyright, trademark
- Credibility: specially relevant in the academic business
- Information overload: we move from an environment of high quality information — because it is produced professionally — towards an amateur created information environment. Related: quality mechanics, reputation, etc. How many RSS feed subscriptions or e-mails a day can you tolerate?
Opportunities
- Media literacy skills
- expression/identity
- empowering creators
- information sharing
- maintaining connections
- semiotic democracy
- access to information
My reflections
Readings
More info
SDP 2007 related posts (2007)
By Ismael Peña-López (@ictlogist), 18 May 2007
Main categories: Connectivity, Digital Divide, e-Readiness, Hardware, ICT4D
2 Comments »
The second edition of the World Information Society Report is out, bringing us a new calculation for the Digital Opportunity Index.
It’s a pity that the graphical representation of the Digital Opportunity Map has changed colors, as it makes it more difficult to compare among years. Nevertheless, here come both maps for 2006 and 2005 (remember that the report shows the DOI for the preceding year):
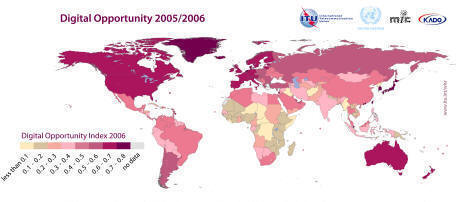
Digital Opportunity Index 2006. Source: World Information Society Report 2007
[click to enlarge]
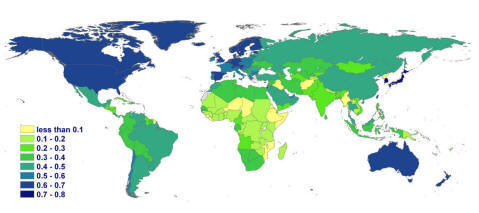
Digital Opportunity Index 2005. Source: World Information Society Report 2006
[click to enlarge]
Major improvements — DOI increases above 20%, World Rank increases above 5 places (most of them are two digits increases) — are those of Antigua & Barbuda, Bangladesh, Barbados, Cambodia, Fiji, Guatemala, Lao P.D.R., Nicaragua, Palestine, Rwanda, St. Kitts & Nevis and Tanzania, reinforcing the trend of some Central America, Africa and Asia countries taking off and showing the path to other countries of the region with poor e-readiness results.
Getting worse — DOI decreases and loss of World Rank places —: Central African Republic, D.R. Congo, Madagascar, Turkmenistan and Zimbabwe, which as happened with the climbers, I think, sadly, does not surprise anyone.
Some other main conclusions are the huge strength of mobile telephony adoption in developing countries — in particular — and in the whole World — in general —, that makes coverage be almost universal and, thus, make the digital divide […] shrinking
. We’ve talked about this statement several times here, and luckily, this time the report warns about the danger that those infrastructures make broadband adoption more difficult than fixed lines, hence the availability and affordability of broadband remain a cause for concern
.
Actually, even if decreasing, inequality in digital development in the World (measured, for instance, through Internet usage) is still a major problem far to be solved and, if worst scenarios about broadband penetration come true, eager to get worse.

 Full Report
