The Millennium Development Goals Indicators Dashboard is an attempt to show how the official UN Millennium Development Goals set could be used for assessing progress, or lack of progress, towards Sustainable Development.
Jointly developed by the International Institute for Sustainable Development and European Statistical Laboratory at the European Commission’s Joint Research Centre, the Dashboard can either be consulted online or downloaded and installed on your PC. Online version shows only data for Africa; local version only runs on MS Windows platforms.
To see an example of its functioning, take the policy that drives Muhammad Yunus, 2006 Nobel Peace Prize: more than 96% of Grameen loans have gone to women, who suffer disproportionately from poverty and who are more likely than men to devote their earnings to their families
. And now see the following map:
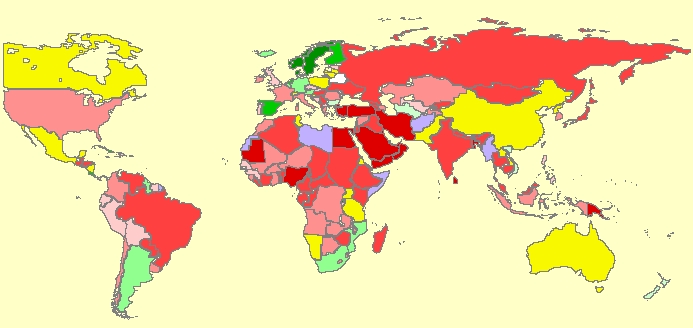
Women in parliamentary seats, 2004 (ITU)
Red pictures most inequality, green pictures equality
[click to enlarge]
Technical note: the Millennium Development Goals Indicators Dashboard is built using the Dashboard of Sustainability, a tool you can personalize to create your own Dashboard to whatever you want to present graphically, the same way the Trendalyzer does.
More information
- Millennium Development Goals Indicators Dashboard
- Bashboard Development Kit
- Millennium Development Goals links collection
[via the Development Gateway]
