By Ismael Peña-López (@ictlogist), 29 October 2016
Main categories: e-Government, e-Administration, Politics, News, Participation, Engagement, Use, Activism, Writings
Other tags: decidim.barcelona, it_for_change, mavc, technopolitics, voice_or_chatter
No Comments »
This research is part of the Voice or Chatter? Using Structuration Framework Towards a Theory of ICT Mediated Citizen Engagement research project led by IT for Change and carried on under the Making All Voices Count programme.
The research began in May 2016 and is about to end by January 2017.
The project consists in analysing several cases of ICT mediated citizen engagement in the world, led by governments with the aim to increase participation in policy affairs.
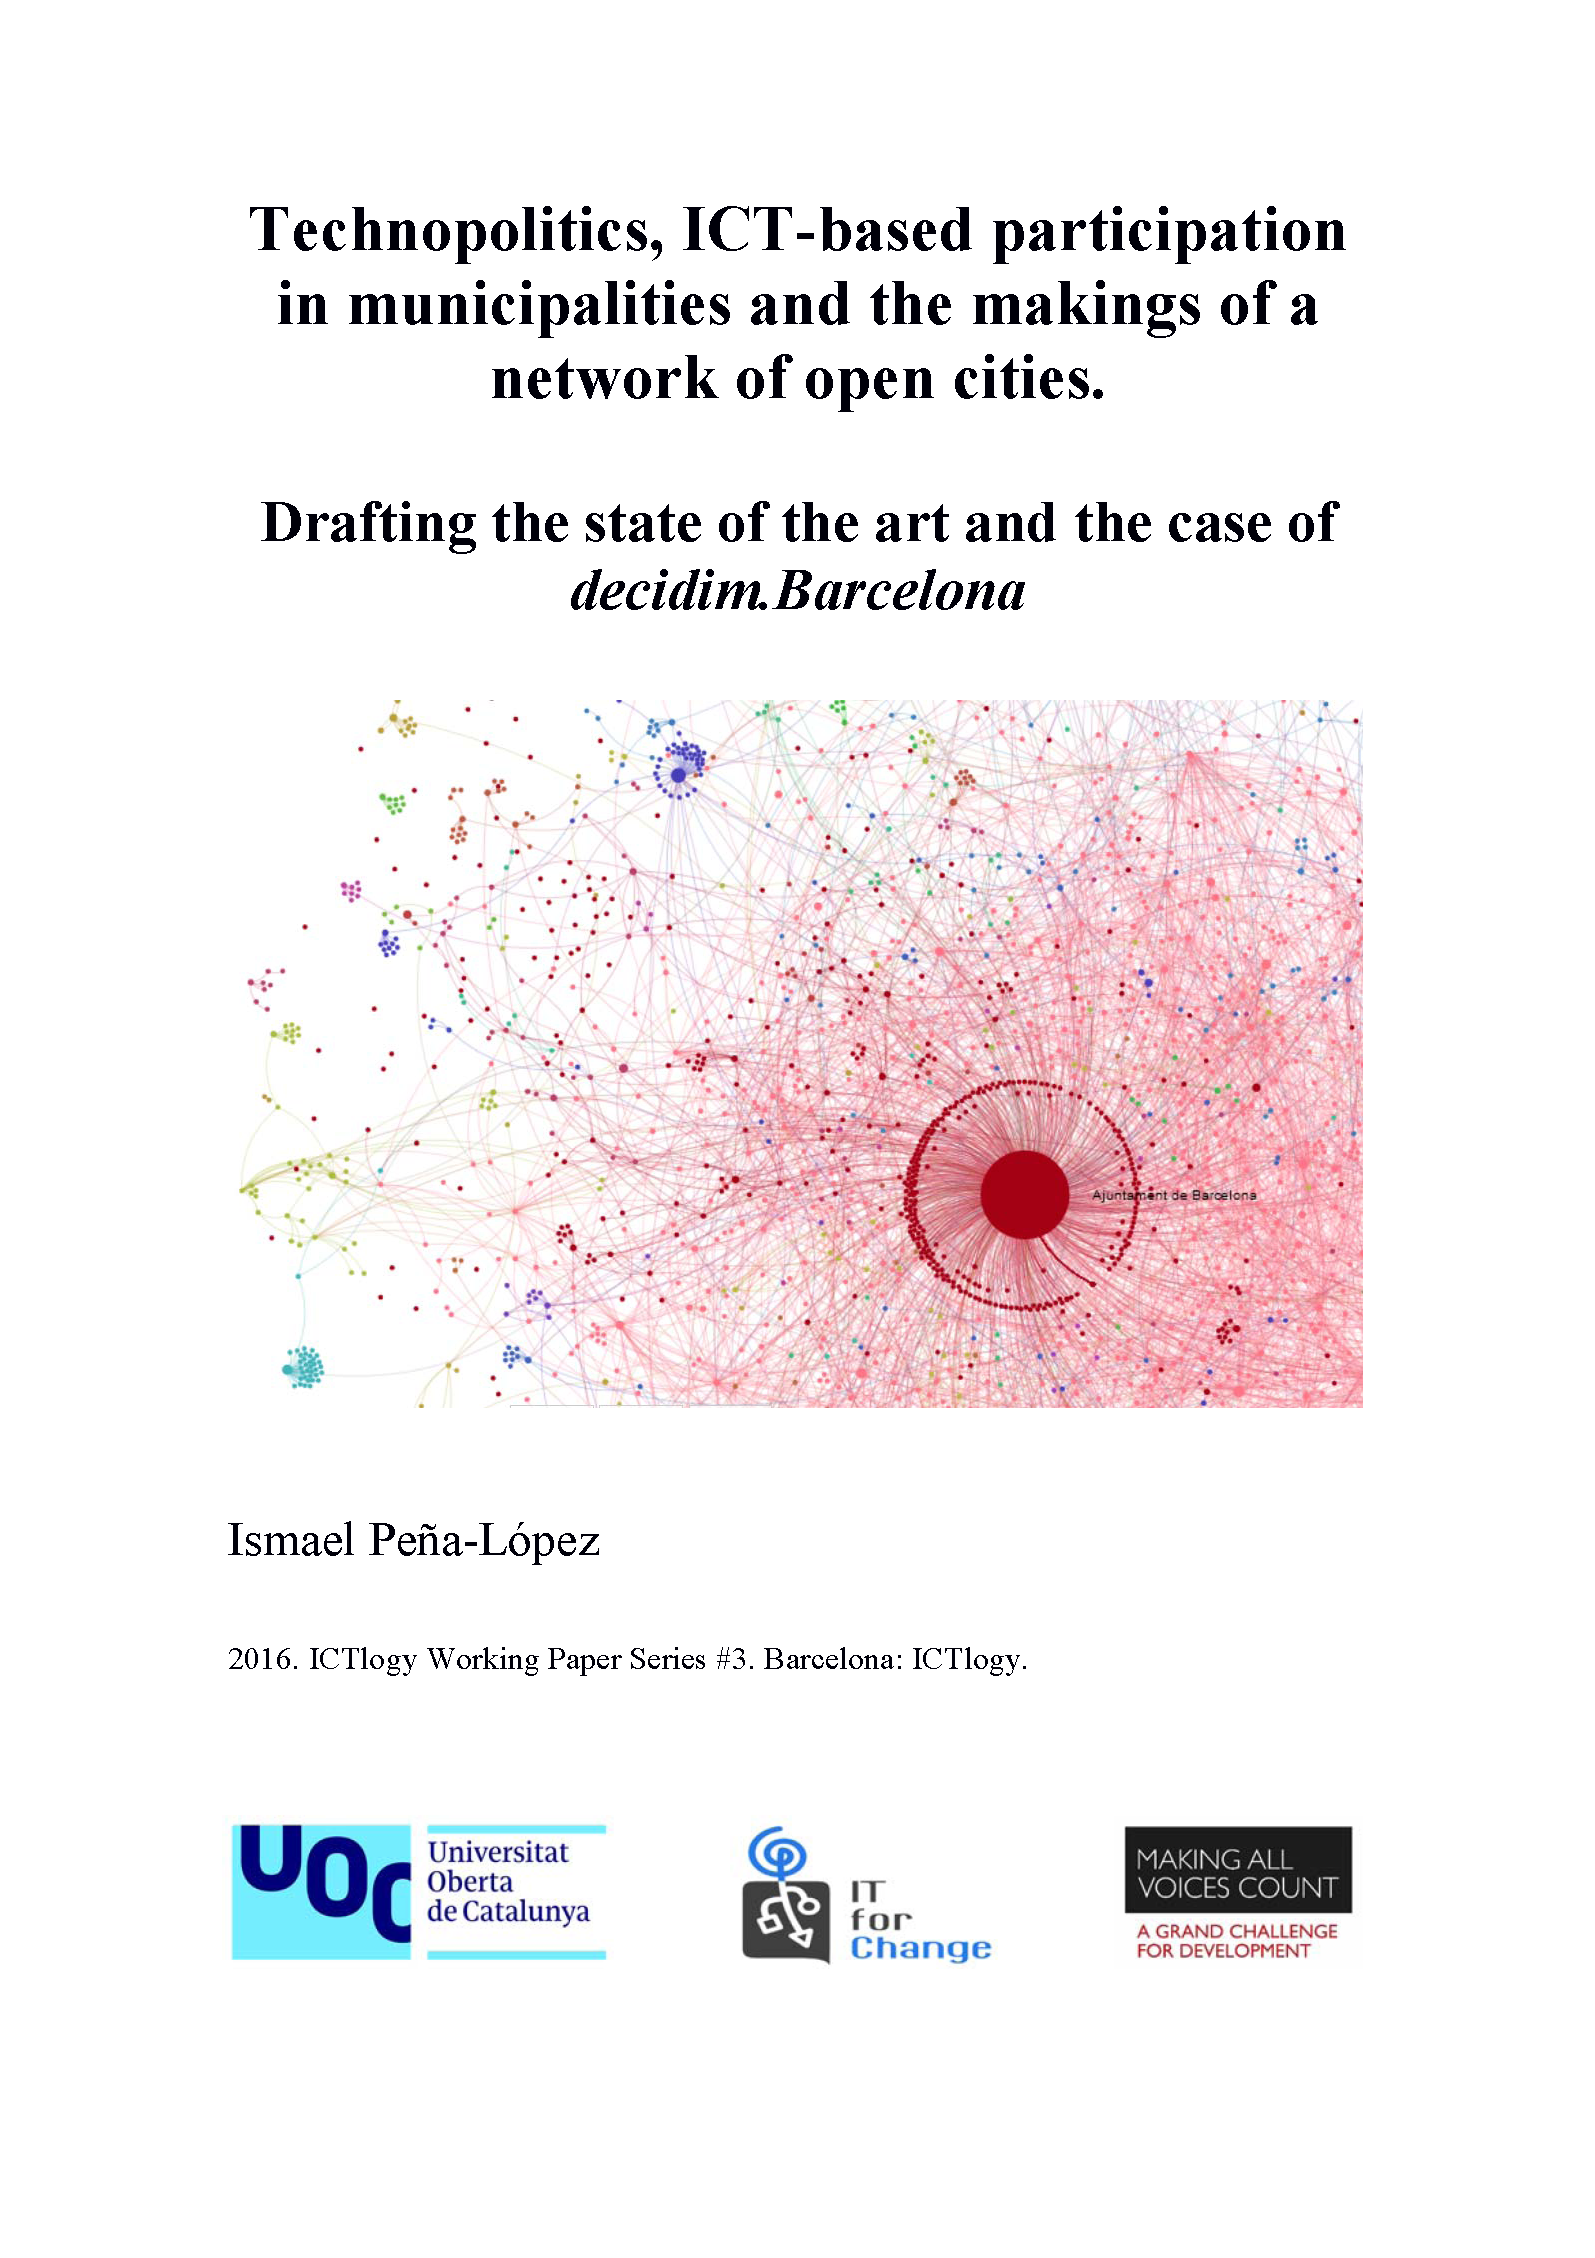
This subproject deals with the case of decidim.Barcelona, an ambitious project by the City Council of Barcelona (Spain) to increase engagement in the design, monitoring and assessment of its strategic plan for 2016-2019.
These specific pages focus on the socio-political environment where this subproject takes place, specifically speaking Barcelona, Catalonia and Spain, for the geographical coordinates, and for the temporal coordinates the beginnings of the XXIst century and most especially the aftermath of the May 15, 2011 Spanish Indignados Movement or 15M – with some needed flashbacks to the restauration of Democracy in 1975-1978.
The working paper Technopolitics, ICT-based participation in municipalities and the makings of a network of open cities. Drafting the state of the art and the case of decidim.Barcelona, thus, aims at explaining how and why such an ICT-based participation project like decidim.Barcelona could take place in Barcelona in the first months 2016, although it will, of course, relate to the project itself every now and then.
Dowloads
By Ismael Peña-López (@ictlogist), 21 October 2016
Main categories: Setup
No Comments »
Today is October 21st, and thus it’s ICTlogy.net anniversary. Its 13th anniversary, to be more precise. Happy anniversary, ICTlogy.
First things first, the quantitative data:
- 1,281 blog posts at the ICT4D Blog, (
 ), 1,397 comments () and 196 pages.
- 318 blog posts at the SociedadRed Blog, (), 1,372 comments () and 3 pages.
- A bibliography with 3,103 works and 2,489 authors ().
- 633 wiki entries (, ).
- 27 learning materials.
- 5631 articles from 126 events from my liveblogging sessions.
- All the usual stuff:
 Twitter,
  delicious,
  Google Calendar,
  Slideshare,
  Prezi,
  YouTube,
  Lifestream/aggregator,
  FriendFeed,
  Linkedin,
  ResearchGate and
  Academia.edu.
Which deserves the yearly comment.
The most evident thing is the low level of activity in both blogs. Only the bibliographic manager has maintained the usual level.
There are two reasons for that.
The first one is lack of time. Lack of time to share not only finished work (i.e. in my works section or readings (i.e. in the bibliography section, but ideas, ramblings thoughts, projects.
The last three years have been hectic and somewhat erratic both in the direction and ways of my research. I was appointed director of open innovation at Fundació Jaume Bofill three years ago and until last February (when I became fellow director, meaning that I still collaborate with the foundation, but with a much lower dedication). These same two years I was senior researcher at Open Evidence, which I definitely quite also in February 2016.
This last year (since half of 2016 until now) I assumed the direction of three masters programmes:
This has been keeping me really busy. Really. And here comes the second reason for this scarce updates: I moved quite a bit of my time from research to academic management. This is being quite rich and interesting, but one loses the edge on one’s own research plans.
Indeed, I am thankful to Ricard, Maria and Can who somewhat forced me to write.
So, I did read and kept updated in the field, but had no time to do things as I used to, putting out there everything from the first idea to the final paper. I do have to solve this.
There is another thing worth being commented.
In recent years we have been witnessing Twitter being a somewhat substitute to blogging. It is happening in academia a lot. Between a quick tweet or two to share an opinion and taking the time to write a blog post, it is a temptation to go for the former.
It is my believe that Twitter withdrew many from having their own website — not to speak about a blog, or a full repository of their work — as it took too much time, and their online presence was already completed by having an active account on Twitter.
It is glad to see how many scholars are entering the realms of ResearchGate and Academia.edu and using them not only to share their work, but to follow others’.
Indeed, it is just great to see quite a good bunch of non-scholars entering these academic social networking sites to follow the work of some scientists. This is a dream come true. And, I would like to think, yet another nail in the coffin of the dated system of academic publishing.
Academic publishing is more than over. It does not provide a satisfactory answer to the needs it used to cover back when it was created: it is a narrow communication channel, it is expensive, it is slow, it limits peer review to only a couple of people or it mixes up the impact of the journal with the utility of a given paper. And, mind you, the current trend of altmetrics still has to acknowledge that there is no evolution in academic publishing, but a transformation. But this is another debate.
Happy thirteenth anniversary, ICTlogy!
By Ismael Peña-López (@ictlogist), 05 October 2016
Main categories: ICT4D, Meetings, Open Access
Other tags: iodc16, opencitiessummit, open_data
No Comments »
Ideathon workshops takeaways
Open data portals and engagement mechanisms
Who is a user of the open data portal? After identifying the user, a user list sorted by priority should be drawn.
Scholars should explain what open data is and promote it’s use.
Free open data management tools.
Keep data updated and update it and make it known.
How do tell the quality of open data? How do we know about its usage?
We have a lot of data, but we lack the storytelling, the visuals.
What makes sense for a government, what can work for them, what makes sense for technicians.
We need open data champions.
The charter seems simple but its application is complex. It is a good idea to ‘deconstruct’ it principle by principle, recommendation by recommendation, and go step by step while aiming for the whole.
Create networks of cities that have adopted the charter and see how they did it.
Competitiveness and economic development
We have to identify what is the problem. But not like “unemployment is the problem” but more focused on people. And then, try to come up with an idea that most people will quickly understand because it relies with some other familiar initiative (e.g. “Facebook for dogs”).
We can create the “Tinder for data”, a meta-data portal for open data. It would identify data that could be open and thus create opportunities.
Smart and resilient cities
Bring the users in the design of the projects.
Identify the key role players and establish communication strategies among them.
How do we enable the measurement of vulnerability and how to address it. What defines a resilient city.
Interdisciplinary collaboration and organizational change
Better name: culture change for common understanding.
Start with the challenge.
Creating common context.
Actively create and maintain feedback.
Go across disciplines and across sectors.
Interaction between civil society organizations and between civil society organizations and governments.
Fiscal transparency
Entrepreneurs, SMEs, etc.: they might find hard to find the kind of information that is relevant to them. What are they needs? What are the usual tasks that require data? Awareness on their needs and awareness of the possibilities of open data.
Try and draw a chronological story of data for firms: When starting a business, what is the information that you need? What is the government spending (procurement) in the field? What is the budget and what is the execution of that budget. Do I have benefits for operating in this field? What are the trends in my area?
Making city services accessible
It is very difficult for people to see the safety net, to know what public services can one citizen access.
To build a healthy ecosystem, accessible, interoperable, sustainable, that relates referral providers and social service services.
Standards and interoperability
A good way to understand standards and interoperability is by looking at the path that goes from raw data to indicators, in an aggregation process.
The big issue is that standards apply to very small portions of reality, while reality is much more complex. Open data, smart cities, open government, etc. begin to create their own specific (ad hoc) standards that often overlap.
Who provides the data and how?
Who will reuse the data and how?
4th International Data Conference (2016)
By Ismael Peña-López (@ictlogist), 05 October 2016
Main categories: ICT4D, Meetings, Open Access
Other tags: eric_reese, iodc16, katelyn_rogers, opencitiessummit, open_data
No Comments »
Ideathon workshops: Interdisciplinary collaboration and organizational change Katelyn Rogers, Open Knowledge Foundation Eric Reese, Johns Hopkins University
Agencies that do not talk to each other.
Barriers to work with other organizations, especially across disciplines.
Political impact vs. technical impact:
- what are the priorities
- budget constraints
- role of infomediaries
- Horizontal collaboration vs. hierarchical paths
- multidepartment teams
- who leads (what department leads)
Restarting connections, changes in leadership (e.g. elections change the mayor, etc.), having to convince again the leaders or decision-makers
The is not an internal culture of data.
How does institutionalization happens?
Is open data part of the internal/institutional process?
Technical language might be a barrier.
- have to explain what technology does or implies, e.g. what an API or JSON is and what it does and what it implies
- have to build a space so that everybody understands the concepts
How to?
- identify the beneficiaries
- identify the different usages
- create feedback loops
- make positive stories
- remove the barriers for the people to engage (with agencies), often meaning removing the middle-man, shortening the gap between users and agencies, making agencies accountable of their own data
- build communication channels that are constructive
- give them answers not just raw data
- empower people
- allow people to engage with information, sometimes even providing different interfaces for the very same data, but or different profiles
- build trust, active listening
Takeaways
- Start with the challenge. This includes the law, legacy systems, social context.
- Using/creating common language together, creating a common place/context.
- Building trust, making sure that feedback loops exist, having an ear and being able to listen, remove barriers to conversations.
4th International Data Conference (2016)
By Ismael Peña-López (@ictlogist), 05 October 2016
Main categories: ICT4D, Meetings, Open Access
Other tags: iodc16, opencitiessummit, open_data
No Comments »
Petcha Kucha presentations of the eight projects developed along Visualizar’16 international workshop at Medialab-Prado (26 September – 5 October
Presented by José Luis de Vicente
staDAtus: a way to escape the Desert of Knowledge
Most of research results are not transparent. On the other hand, most citizens neither realize the importance of transparency nor where to get the data in case they would like to. staDatus aims at showing the state of transparency/open data portals.
staDatus is a community-based/crowdsourced project. It creates templates so that citizens can track and assess portals, especially according to what the law says. These tools will be designed with gamification methodologies in able to help citizens.
urBside-art
The project is made up by artists and architects and focuses on the solid waste that cities produce, with the aim to raise awareness on this issue. Another goal is to democratize art.
An app has been developed to help citizens and urban artists to share their works and to enable interaction between citizens and urban art.
The project aims at monitoring the behaviour of visitors in cultural institutions. Museums need to know what visitors do, what do they do, how do they move in order to be able to give them the best experience.
Re-thinking the museum has to take into consideration storytelling, interaction, etc.
The project has developed an app that mixes tracking with augmented reality. As the visitor moves inside the museum, the application will give the visitor (augmented reality) information, enable interaction, etc. On the other hand, this will also produce tracking data that the museum can use to reflect on the exposition or the cultural activity.
Gala
Goal: show/visualize the concerts happening all over the world as a galaxy/constellation according to the musical gender. Data comes from last.fm
The visualization can help to identify music styles geographic clusters, or how e.g. minority styles spread and evolve.
What is the resilience of a city regarding its manufacturing, distribution and consumption of goods?
What is the role of citizens in shaping a Fab City with open, distributed and collaborative initiatives?
A dashboard has been created to monitor eleven measurements for the resilience of a city.
The dashboard can also be used to measure the impact of a given project on resilience on the city.
Goal: Mapping micro-conflicts through people experiences.
(Please follow the link above. See also http://commonactionforum.net/projects/)
Information about health, people and social services. From long documents in PDF format to structured open data.
An application makes it easy to scrap, store and publish data. And it can be done in a crowdsourced way.
apps4citizens is a collection of apps for citizen action.
An app has been deployed to map these apps in the territory using Quadrigram.
4th International Data Conference (2016)
By Ismael Peña-López (@ictlogist), 05 October 2016
Main categories: ICT4D, Meetings, Open Access
Other tags: barbara_ubaldi, dinand_tinholt, iodc16, jean-noe_landry, opencitiessummit, open_data, stephen_larrick
No Comments »
Expert panel on what is an open city: emerging trends, scaling opportunities, strengthening networks.
Moderator: Antonio Moneo-Laín (IADB)
Barbara Ubaldi, OECD
Open data needs cities because cities know who the local actors are.
Because open data is about action.
Networks of cities — within the country or at the international level — are very important.
Jean-Noé Landry, Open North
How do we reconcile the opportunity of open data with the resilience of cities.
Most of the global open data movement has been led by citizens, nonprofits, etc. How can local governments empower these actors?
It is important what happens before data is released, what are the ethics behind making data available.
Where does the demand come from? Who has the means to ask for data? We have to look into that carefully.
Stephen Larrick, Sunlight
How do we scale local open data programmes and make them global (and sustainable)?
Risk-aversion can be “medicated” by showing that your programme works in another place.
Open formats also help to connect with other actors, to scale up.
If open data is not only about data but about decentralization of democracy, about engagement of the citizen, then this ethos has to be included in the very design of any open data initiative.
We have to link engagement to specific needs. Start with the needs of citizens, not with open data.
Dinand Tinholt, European Data
How do we make open data a priority?
Build upon what others are doing.
It is important that there also is an economic insight in open data. It may not be very “sexy” but it is important to bring in companies that will use open data for profit, as they contribute to make the system sustainable, to foster demand and to maintain it live.
4th International Data Conference (2016)